As we get ready for this year’s 2017 Cambridge municipal election, here are a few "Fun Facts":
The total number of registered voters for the Nov 2017 election is 66,354. Their median age is 37.9. Here’s how their ages (as of Election Day – Nov 7, 2017) are distributed (in 3-year intervals):

Registered Voters – 2017
For the Nov 2015 election, there were 63,338 registered voters with identified birthdates. Their median age was 38.7. Here’s how their ages (as of Election Day – Nov 3, 2015) were distributed (in 3-year intervals):

Registered Voters – 2015
Of these registered voters, 17,959 voted in the 2015 municipal election. Their median age was 56.0. Here’s how their ages were distributed (in 3-year intervals):

Registered Voters Who Voted in the 2015 Municipal Election
If you compare 2015 and 2017, you can see that most of the gains in registered voters are in the younger age ranges – especially the 24-29 range.
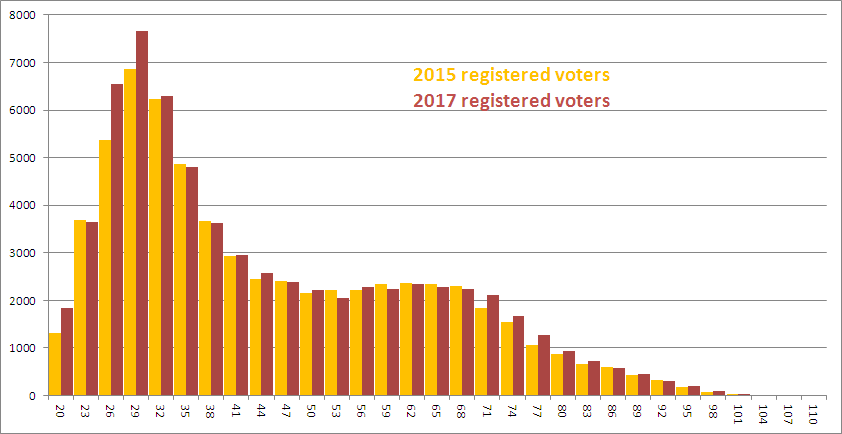
It will be interesting to see if these shifts will be reflected in the age distribution of those who vote in the Nov 2017 election.
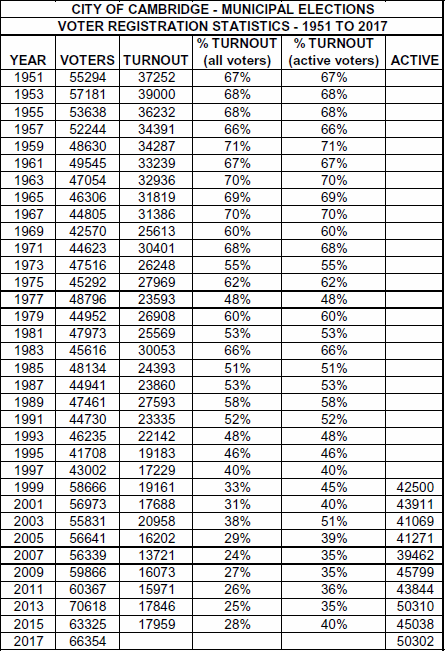
The total voter turnout has dropped over the years but has remained relatively stable for the last several municipal elections.


Thanks for posting. Two quick questions:
1) Have Cambridge elections always been in off years?
2) When did the voting age decrease from 21 to 18?
Just wondering if either of these factors are in part responsible for the overall drop in turnout.
Comment by Doug Brown — November 5, 2017 @ 10:18 am
We switched from annual to biennial elections about 100 years ago and I believe the elections have been in odd years since then (and during the whole time showed in my chart).
1971 for the drop from 21 to 18 – not much of an effect in Cambridge:
https://en.wikipedia.org/wiki/Twenty-sixth_Amendment_to_the_United_States_Constitution
My recollection is that university students were not encouraged to vote locally, though they had every right to do so.
The end of rent control following the 1994 Question 9 initiative petition led to the most significant drop in voter turnout. Prior to that most renters had a significant personal economic interest in the election outcome (cheap rent).
As for the sudden rise in registered voters in 1999, that is attributable to the “Motor Voter Law” that mandated that registered voters could not be purged without going through at least two state election cycles and only then after being sent mail giving them a chance to dispute it. Ever since then many of the “Inactive” voters aren’t really living in Cambridge any more. That’s why I choose to use the “Active” voters as a better estimate of the number of actual voters even though some voters who are listed as “Inactive” will actually vote.
Another possible cause for the long-term decline in voter turnout is that political patronage largely vanished, so voting for “the right candidate” had less of an effect in getting a job “on the City”. The gradual replacement of long-time residents and families by more transient people has undeniably had an effect on voter turnout.
Comment by Robert Winters — November 5, 2017 @ 11:05 am
I notice that these days there’s always a bump in number of voters the year after a presidential election, but in the 50’s and 60’s there wasn’t.
Comment by Laura E Conrad — November 6, 2017 @ 8:58 am
Thanks for the stats, graphics & extra hours recently Robert. Such a great resource –
Comment by george stylianopoulos — November 6, 2017 @ 9:48 am