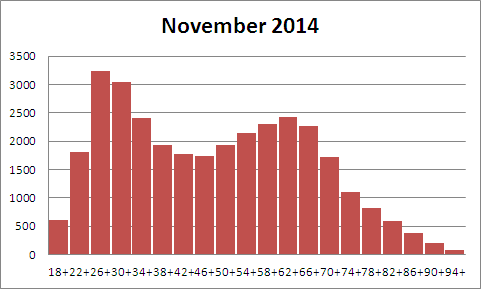
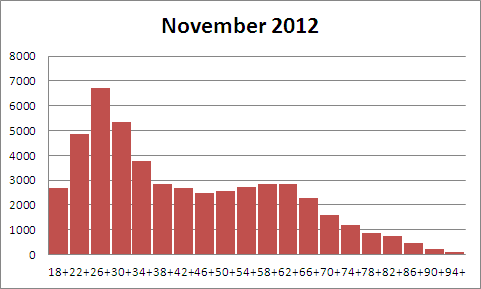
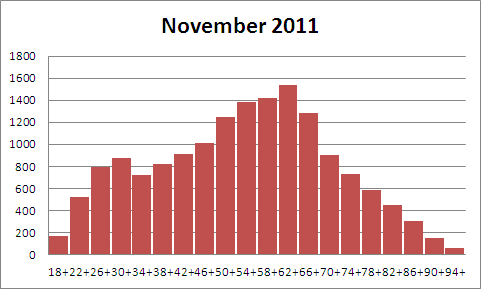
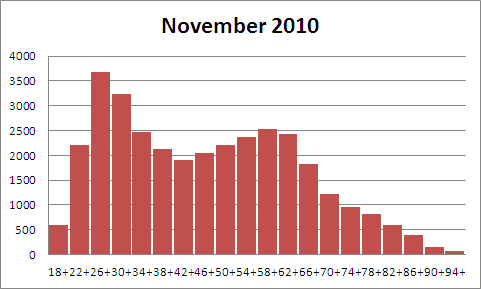
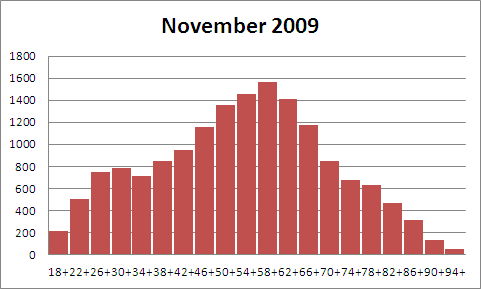
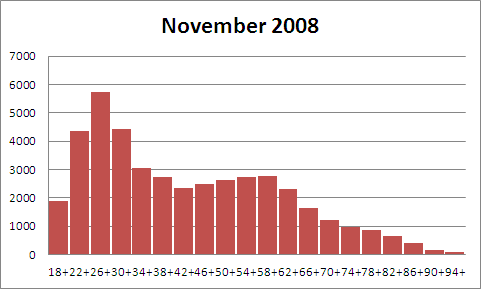
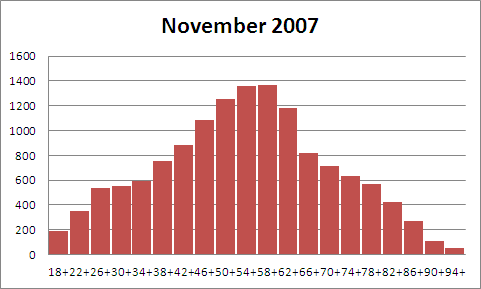
Age Distribution of Voters in Cambridge Elections: 2007-2014
| Nov 2007 municipal |
Nov 2008 federal |
Nov 2009 municipal |
Nov 2010 state |
Nov 2011 municipal |
Nov 2012 federal |
Nov 2013 municipal |
Nov 2014 state |
|
| Cambridge voters | 13703 | 43482 | 16001 | 33840 | 15907 | 49835 | 17800 | 32569 |
| Median Age | 55.9 | 41.3 | 55.2 | 47.4 | 56.5 | 40.1 | 56.4 | 49.3 |
| Average Age | 55.6 | 44.8 | 56.1 | 48.4 | 55.3 | 44.5 | 54.6 | 49.8 |
 |
 |
 |
 |
 |
 |
 |
 |
Note: Data used for this analysis comes from the Cambridge registered voter database and voter history files for the respective years. Voters without specified birthdates have been excluded (very small number). In addition, a small number of public safety officials are also not included in the publicly available registered database.