As we get ready for this year’s 2017 Cambridge municipal election, here are a few "Fun Facts":
The total number of registered voters for the Nov 2017 election is 66,354. Their median age is 37.9. Here’s how their ages (as of Election Day – Nov 7, 2017) are distributed (in 3-year intervals):

Registered Voters – 2017
For the Nov 2015 election, there were 63,338 registered voters with identified birthdates. Their median age was 38.7. Here’s how their ages (as of Election Day – Nov 3, 2015) were distributed (in 3-year intervals):

Registered Voters – 2015
Of these registered voters, 17,959 voted in the 2015 municipal election. Their median age was 56.0. Here’s how their ages were distributed (in 3-year intervals):

Registered Voters Who Voted in the 2015 Municipal Election
If you compare 2015 and 2017, you can see that most of the gains in registered voters are in the younger age ranges – especially the 24-29 range.
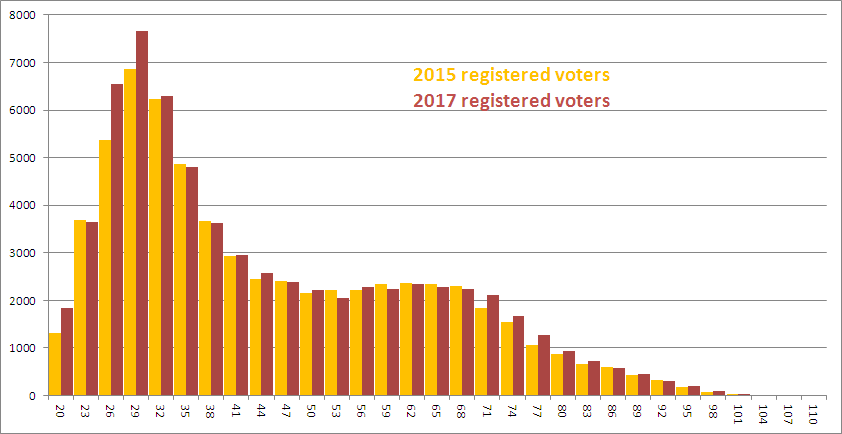
It will be interesting to see if these shifts will be reflected in the age distribution of those who vote in the Nov 2017 election.
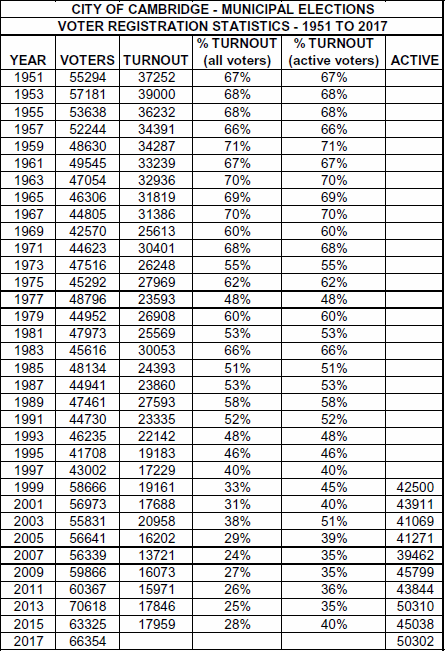
The total voter turnout has dropped over the years but has remained relatively stable for the last several municipal elections.